Transition Matrix
Corporate - 2023
NCR has conducted transition matrix analysis of the rated corporate clients from the year 2018 to year 2023. Transition matrix analysis is done to see the percentage of changes in credit rating of each rating category.
One Year’s Weighted Average Rating Transition Rates from the Year 2018 to Year 2023

Rating transition study looks at how ratings have changed over a period of time. Based on NCR’s weighted average one-year transition matrix, it can be inferred that out of all the ‘A’ rated companies at the beginning of the year 78.62% remained in the same category, 15.92% have been upgraded to ‘A+’ and 4.97% have been downgraded to ‘A-’ category. Similar inferences can be drawn for the other rating categories as well.
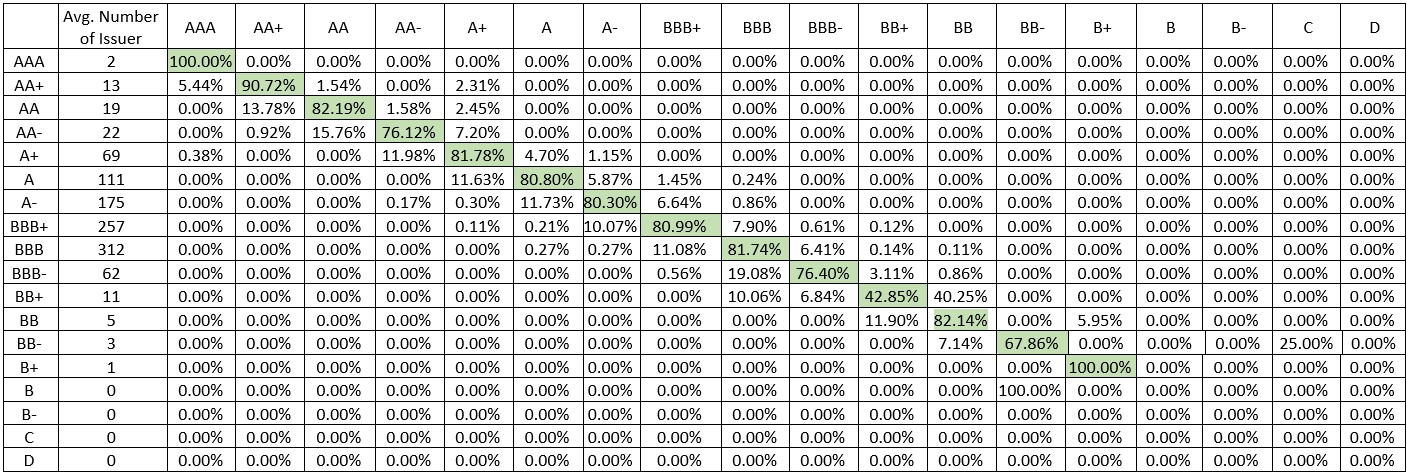
Corporate - 2022
NCR has conducted transition matrix analysis of the rated corporate clients from the year 2017 to year 2022. Transition matrix analysis is done to see the percentage of changes in credit rating of each rating category.
One Year’s Weighted Average Rating Transition Rates from the Year 2017 to Year 2022

Rating transition study looks at how ratings have changed over a period of time. Based on NCR’s weighted average one-year transition matrix, it can be inferred that out of all the ‘A’ rated companies at the beginning of the year 80.80% remained in the same category, 11.63% have been upgraded to ‘A+’ and 5.87% have been downgraded to ‘A-’ category. Similar inferences can be drawn for the other rating categories as well.
SME- 2023
NCR has conducted a transition matrix analysis of the rated SME clients from the year 2018 to year 2023. Transition matrix analysis is done to see the percentage of changes in the credit rating of each rating category.
One Year’s Weighted Average Rating Transition Rates from the Year 2018 to Year 2023

Rating transition study looks at how ratings have changed over a period of time. Based on NCR’s weighted average one-year transition matrix, it can be inferred that out of all the ‘NSME-3’ rated companies at the beginning of the year 90.93% remained in the same category, 6.50% have been upgraded to ‘NSME-2’ and 2.45% have been downgraded to ‘NSME-4’ category. Similar inferences can be drawn for the other rating categories as well.
SME- 2022
NCR has conducted a transition matrix analysis of the rated SME clients from the year 2017 to year 2022. Transition matrix analysis is done to see the percentage of changes in the credit rating of each rating category.
One Year’s Weighted Average Rating Transition Rates from the Year 2017 to Year 2022

Rating transition study looks at how ratings have changed over a period of time. Based on NCR’s weighted average one-year transition matrix, it can be inferred that out of all the ‘NSME-3’ rated companies at the beginning of the year 93.67% remained in the same category, 2.97% have been upgraded to ‘NSME-2’ and 3.21% have been downgraded to ‘NSME-4’ category. Similar inferences can be drawn for the other rating categories as well.
|
Disclaimer: The Methodology is developed by National Credit Ratings Limited (NCRL) based on data/information from secondary reliable sources which is in compliance with the guidelines provided by Bangladesh Securities and Exchange Commission and Bangladesh Bank. NCRL puts best efforts to prepare this document. The methodology may inherit human error, technical and/or systematic error as its limitation. Therefore, NCRL does not provide warranty of any kind for this document. This is the property of NCRL and is only used for rating of corporate issues. None of the information in this document can be copied or otherwise reproduced, stored or disseminated in whole or in part in any form or by any means whatsoever by any person without written consent of NCRL. |
For further details please contact:
National Credit Ratings Ltd.
Zaman Tower (8th Floor)
37/2, Box Culvert Road, Purana Paltan
Dhaka-1000
Tel: +88-02-47120156-58
e-mail: ncrlbd10@yahoo.com, info@ncrbd.com
website: www.ncrbd.com

